|
전자부품 데이터시트 검색엔진 |
|
|
전자부품 데이터시트 검색엔진 |
|
WM2619 데이터시트(PDF) 5 Page - Wolfson Microelectronics plc |
|
|
|||||||||||||||||||||||||||||
WM2619 데이터시트(HTML) 5 Page - Wolfson Microelectronics plc |
|
|
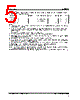
5 / 9 page  Production Data WM2619 WOLFSON MICROELECTRONICS LTD Production Data Rev1.0 June 1999 5 Test Conditions: RL = 10k Ω, C L = 100pF. VDD = 5V ±± 10%, V REF = 2.048V and VDD = 3V ±± 10%, V REF = 1.024V over recommended operating free-air temperature range (unless noted otherwise) PARAMETER SYMBOL TEST CONDITIONS MIN TYP MAX UNIT Digital Inputs High level input current IIH Input voltage = VDD 1 µA Low level input current IIL Input voltage = 0V -1 µA Input capacitance CI 8 pF Notes: 1. Integral non-linearity (INL) is the maximum deviation of the output from the line between zero and full scale (excluding the effects of zero code and full scale errors). 2. Differential non-linearity (DNL) is the difference between the measured and ideal 1LSB amplitude change of any adjacent two codes. A guarantee of monotonicity means the output voltage changes in the same direction (or remains constant) as a change in digital input code. 3. Zero code error is the voltage output when the DAC input code is zero. 4. Gain error is the deviation from the ideal full scale output excluding the effects of zero code error. 5. Power supply rejection ratio is measured by varying VDD from 4.5V to 5.5V and measuring the proportion of this signal imposed on the zero code error and the gain error. 6. Zero code error and Gain error temperature coefficients are normalised to full scale voltage. 7. Output load regulation is the difference between the output voltage at full scale with a 10k Ω load and 2kΩ load. It is expressed as a percentage of the full scale output voltage with a 10k Ω load. 8. IDD is measured while continuously writing code 2048 to the DAC. For VIH < VDD - 0.7V and VIL > 0.7V supply current will increase. 9. Typical supply current in power down mode is 10nA. Production test limits are wider for speed of test. 10. Slew rate results are for the lower value of the rising and falling edge slew rates. 11. Settling time is the time taken for the signal to settle to within 0.5LSB of the final measured value for both rising and falling edges. Limits are ensured by design and characterisation, but are not production tested. 12. SNR, SNRD, THD and SPFDR are measured on a synthesised sinewave at frequency fOUT generated with a sampling frequency fs. |
|
|
링크 URL |
| ALLDATASHEET 가 귀하에 도움이 되셨나요? [ DONATE ] |
Alldatasheet는? | 광고문의 | 운영자에게 연락하기 | 개인정보취급방침 | 링크 투 데이터시트 | 링크교환 | 제조사별 검색 All Rights Reserved©Alldatasheet.com |
| Russian : Alldatasheetru.com | Korean : Alldatasheet.co.kr | Spanish : Alldatasheet.es | French : Alldatasheet.fr | Italian : Alldatasheetit.com Portuguese : Alldatasheetpt.com | Polish : Alldatasheet.pl | Vietnamese : Alldatasheet.vn Indian : Alldatasheet.in | Mexican : Alldatasheet.com.mx | British : Alldatasheet.co.uk | New Zealand : Alldatasheet.co.nz |
|
Family Site : ic2ic.com |
icmetro.com |
 Korean ▼
 English
 Chinese
 German
 Japanese
 Russian
 Korean
 Spanish
 French
 Italian
 Portuguese
 Polish
 Vietnamese
 Indian
 Mexican
 British
 New Zealand