|
전자부품 데이터시트 검색엔진 |
|
|
전자부품 데이터시트 검색엔진 |
|
ADL5569BCPZ-R7 데이터시트(PDF) 18 Page - Analog Devices |
|
|
|||||||||||||||||||||||||||||
ADL5569BCPZ-R7 데이터시트(HTML) 18 Page - Analog Devices |
|
|
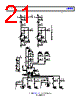
18 / 23 page  ADL5569 Data Sheet Rev. C | Page 18 of 23 EFFECT OF LOAD CAPACITANCE Load capacitance, including stray capacitance from PCB traces, affects the bandwidth and flatness of the ADL5569 frequency response, resulting in excessive peaking. It is recommended to add 5 Ω external series resistors to each output to isolate the load capacitance from the outputs and to effectively reduce peaking. Respective frequency responses resulting from the addition of a 0.5 pF to a 2.0 pF differential load capacitance are shown in Figure 46. 25 20 15 10 5 0 –10 –5 10M 10G FREQUENCY (Hz) 100M 1G 1.0pF 0.5pF 0pF 2.0pF Figure 46. Frequency Response for Various Load Capacitances, RL = 100 Ω GSPS ADC INTERFACING A wideband data acquisition system using the ADL5569 together with the AD9689, a dual 14-bit ADC, was developed and tested as shown in Figure 49 for ac-coupled applications. The amplifier output common-mode voltage is set to AVDD/2 with the voltage divider formed by the two 10 kΩ resistors on the VCOM pin. However, the VCOM pin can be left open (with a decoupling capacitor as described in Table 4), because there is an internal divider to pull the node to VCC/2 in such cases. The resistor capacitor (RC) filter after the amplifier works with the pole formed by the ADC input capacitance to attenuate the broadband noise and out of band harmonics generated by the amplifier. The RC filter also blocks sharp switching pulses, that is, charge injection from the ADC internal sampling circuitry, from reaching the amplifier outputs and creating nonlinear effects. An additional band-pass filter, specific to the system rejection requirements, is also needed in front of the ADL5569 amplifier to prevent unwanted signals from compressing the amplifier as well as from reaching the ADC. This filter is usually added during bench testing. See the AN-835 Application Note, Understanding High Speed ADC Testing and Evaluation, for additional testing information and setups. The signal-to-noise ratio (SNR) and SFDR with respect to full scale (FS) of the ADC system, is shown in Figure 47 and Figure 48. 40 45 50 55 60 65 70 0 500 1000 1500 2000 2500 3000 FREQUENCY (MHz) AC-COUPLED DC-COUPLED NOTE: ALL TESTING WAS DONE AT –3dBFS. Figure 47. ADC System SNR Referred to Full Scale (SNRFS) vs. Frequency 30 40 50 60 70 80 90 0 500 1000 1500 2000 2500 3000 FREQUENCY (MHz) AC-COUPLED DC-COUPLED NOTE: ALL TESTING WAS DONE AT –3dBFS. Figure 48. ADC System SFDR vs. Frequency |
|
|
링크 URL |
| ALLDATASHEET 가 귀하에 도움이 되셨나요? [ DONATE ] |
Alldatasheet는? | 광고문의 | 운영자에게 연락하기 | 개인정보취급방침 | 링크 투 데이터시트 | 링크교환 | 제조사별 검색 All Rights Reserved©Alldatasheet.com |
| Russian : Alldatasheetru.com | Korean : Alldatasheet.co.kr | Spanish : Alldatasheet.es | French : Alldatasheet.fr | Italian : Alldatasheetit.com Portuguese : Alldatasheetpt.com | Polish : Alldatasheet.pl | Vietnamese : Alldatasheet.vn Indian : Alldatasheet.in | Mexican : Alldatasheet.com.mx | British : Alldatasheet.co.uk | New Zealand : Alldatasheet.co.nz |
|
Family Site : ic2ic.com |
icmetro.com |
 Korean ▼
 English
 Chinese
 German
 Japanese
 Russian
 Korean
 Spanish
 French
 Italian
 Portuguese
 Polish
 Vietnamese
 Indian
 Mexican
 British
 New Zealand